

What a week it was, as the CEO of one of the largest companies in the world was removed amid scandal, including an inappropriate relationship with an alleged Chinese spy. The company that once made up nearly 8% of the entire S&P 500 and had a $5 trillion valuation is now down more than 30% from its recent highs, and it crashed 13% last week alone.
Yet in the face of that potentially adverse news, the S&P 500 gained more than 2% for the week ending Friday, November 13, and chip stocks soared despite the high-profile decliner. How is this possible? Investment dollars left one company but went to its competitors, including the largest gainer in the S&P 500 last week, which was up nearly 20%. In fact, all 11 sectors were higher last week, led by industrials, tech, and financials. The S&P 500 found support near the summer lows and now appears ready to potentially start a year-end rally, as sentiment in many ways was extreme and the sellers may have been exhausted.
Bad before good
The week ending November 6 saw the S&P 500 fall 2.7%, the worst week since the 9% crash in early April 2025 around Liberation Day. Last week it bounced back 2.5%, the fifth best weekly return this year and the best since early August.
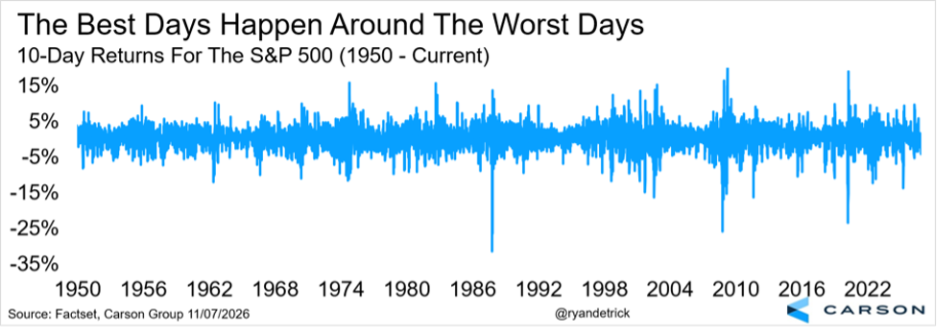
Here’s the thing (and another chart we’ve shared many times): the best days and worst days tend to happen near each other. If you sell after a few bad days, you’ll likely miss the good days that follow. This is all about timeframes, of course, and we are really talking to longer-term investors here. We’ve seen so many investors sell longer-term positions on normal volatility, and they often regret it six months later.
We shared this same chart after the 10% crash in two days around Liberation Day, and we subsequently saw one of the greatest near-term rallies ever. Think of this the next time you want to sell after a few bad days.
Average isn’t so average
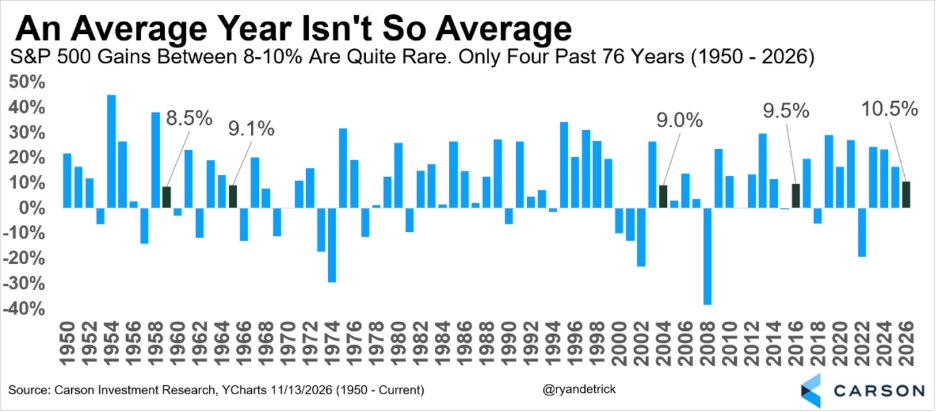
Another chart we’ve shared and discussed for years shows that average returns aren’t so average when it comes to investing. The average year gains around 9%, but did you know that in only four of the past 76 years did the S&P 500 gain between 8% and 10%? That tells us a few things, but mainly that bigger yearly changes (up or down) are perfectly normal.
Which brings us to this year, with the S&P 500 up 10.5% as of Friday’s close. That’s close to “about average,” and you have to ask yourself, “Will the market really stay right here to the end of the year?” We’d say history suggests that’s unlikely. If that turns out to be right, the index would have to go either higher or lower from here, and we still think the likely move is a solid rally into year-end.
Remember inflation? It’s still hot
Amid all the drama of the election and the ensuing tech wreck (despite the huge rally on Monday, November 9, the technology sector was still more than 15% below its October 6 peak as of Tuesday, November 10), you could be forgiven for not thinking about inflation for a moment. Of course, inflation was front and center for voters in the midterm elections. Voters basically told us that inflation remains a key issue, and that they didn’t think Republicans (who control the White House, Senate, and House) did enough to control it. Even worse, like them or don’t like them, tariffs and the war in the Middle East helped push inflation higher. However, as we’ve pointed out since the start of the year, the inflation problem goes beyond higher energy prices (due to the war) and higher goods prices (due to tariffs). AI-related bottlenecks have boosted inflation, which is perhaps why a bear case for AI/tech may be a positive for inflation coming down. Still, the inflation problem goes beyond even energy, tariffs, and AI-related bottlenecks. Right now, the inflation problem is being expressed broadly across the economy.
Headline CPI rose 0.35% in October (4.3% annualized), with prices up 5.7% annualized over the past three months. There are no official year-over-year numbers because of missing data during the October 2025 government shutdown. But averaging September and November 2025 puts CPI inflation at 3.9% over the past year.
Restaurant prices point to broader pressures
If you think the inflation heat is just about energy, think again. Grocery prices rose at a 5.5% annualized pace in October and 1.7% over the past three months. Seated restaurant prices are heating up too (what the government calls “full-service meals and snacks”). We track seated dining because it’s a good gauge of underlying inflationary pressures, combining several drivers:
- Food inflation, and even energy prices (including transportation)
- Rent of restaurant premises
- Worker wages
The numbers here don’t look great. Full-service restaurant prices rose at an 8.1% annualized pace in October, taking the three-month pace to 5.6% and the 12-month change to 3.8%, above the 2019 pace of 3.3% and inconsistent with “normal” 2% inflation.
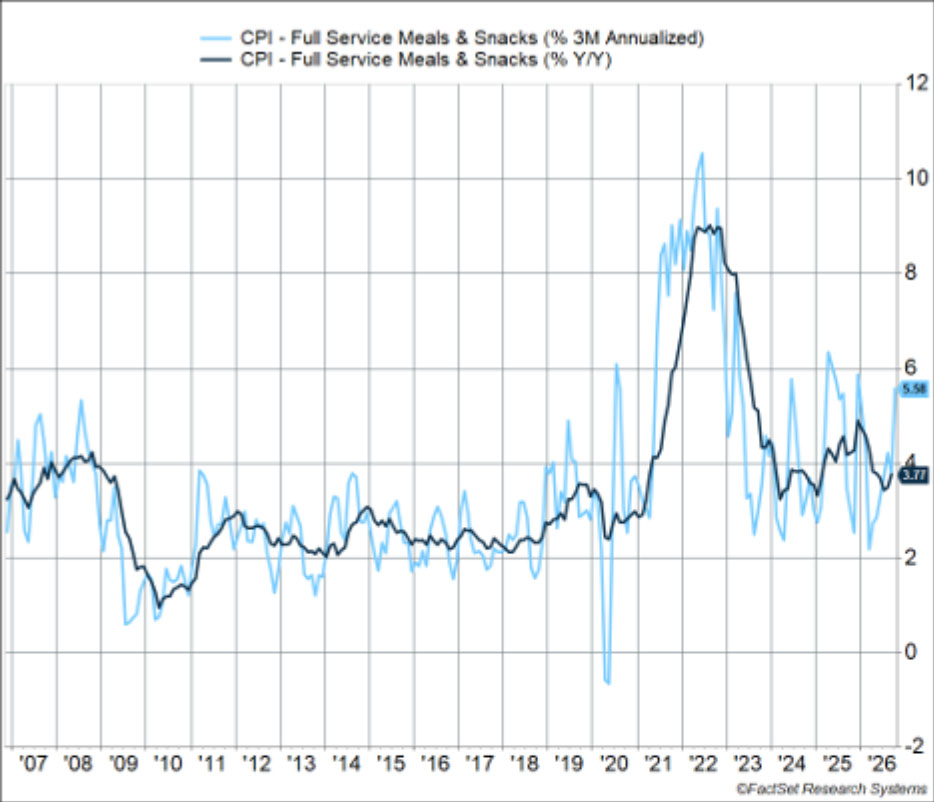
Higher diesel prices amid the Middle East crisis and Russia-Ukraine war are an obvious problem for food transportation, with likely more to come. But restaurant inflation running hotter than groceries suggests other pressures too, including wages amid a stronger labor market.
Core inflation doesn’t look great, either
Even the reading that excludes food and energy, “core CPI,” doesn’t look great. It rose at a 3.6% annualized pace in October, near its three-month run-rate of 3.7% and above the year-over-year pace of 2.8%. It’s worth looking at its three key components.
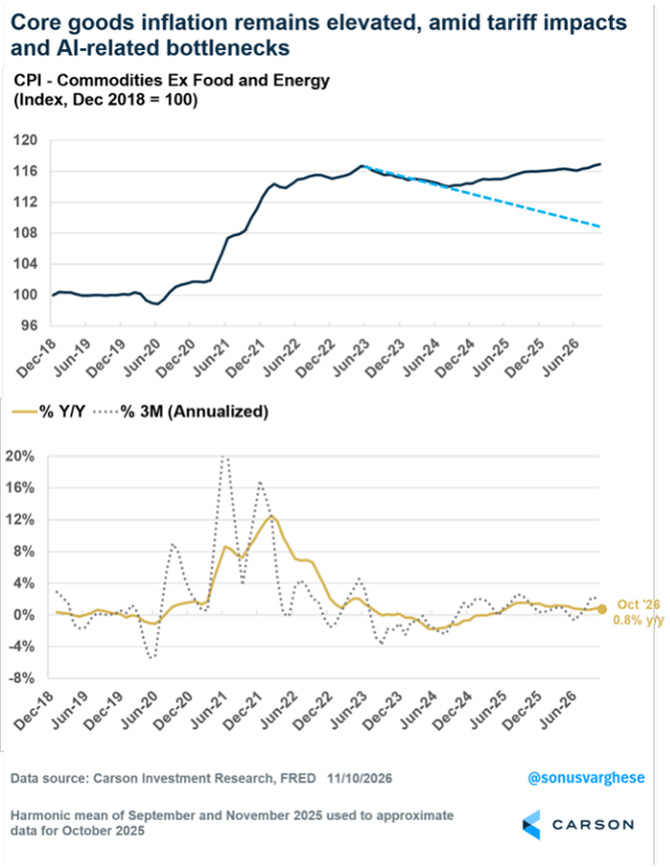
1) Core goods prices (including cars, furniture, appliances, apparel, and computers): These prices consistently fell from 1995–2021, before reversing amid the post-pandemic supply chain crisis. They fell again in 2023–2024, moving back toward their pre-pandemic trend. But tariffs and AI-related bottlenecks have pushed them higher for over a year and a half. CPI for commodities excluding food and energy rose at a 1.9% annualized pace in October, taking the three-month run-rate to 2.1%. Prices are up 0.8% from a year ago. That may not sound hot, but remember that prices were falling before. They’re about 8% higher than if the 2023–2024 decline had continued. Clearly, tariff pass-through to consumers isn’t over.
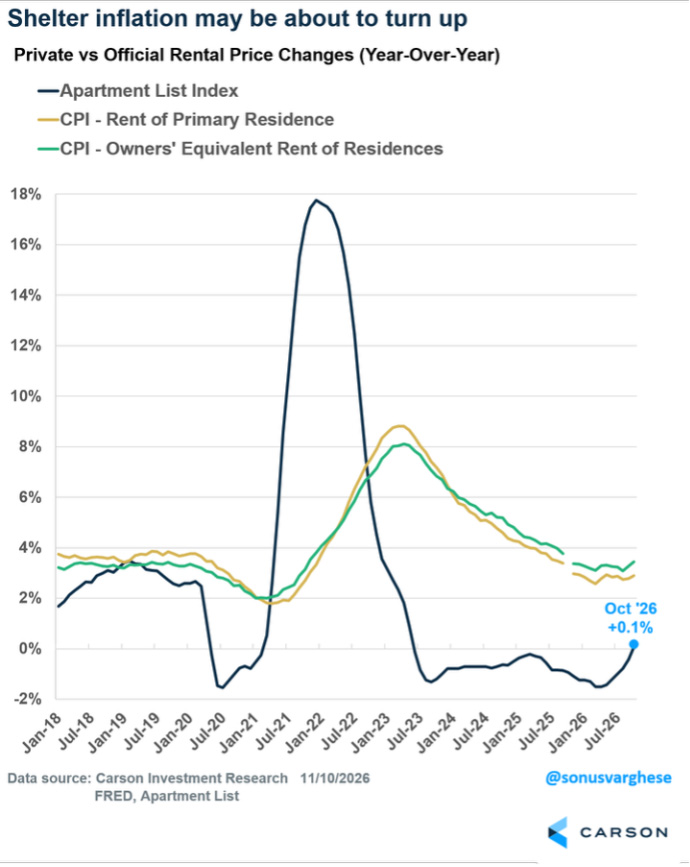
2) Shelter inflation: Shelter has been a disinflationary tailwind for the last couple of years, across rents and “owners’ equivalent rent” (an estimate of rents homeowners would pay). But elevated mortgage rates are keeping people from buying homes, putting pressure on rents. For the first time in almost three and a half years, the Apartment List rental index shows rents rising from a year ago (+0.1%). Official data lags by over a year, but those numbers are stabilizing and likely to rise next year. That will put more pressure on inflation, especially since shelter makes up over 40% of core CPI.
3) Core services inflation excluding housing (“supercore“): This is running hot too. The category is a grab bag, including airfares, hotels, personal care, pet services, and concerts. Supercore inflation rose at a 4.9% annualized pace in October, taking the three-month pace to 5.4% and the 12-month change to 3.7%. This metric averaged just 2.2% annualized from 2017 to 2019.
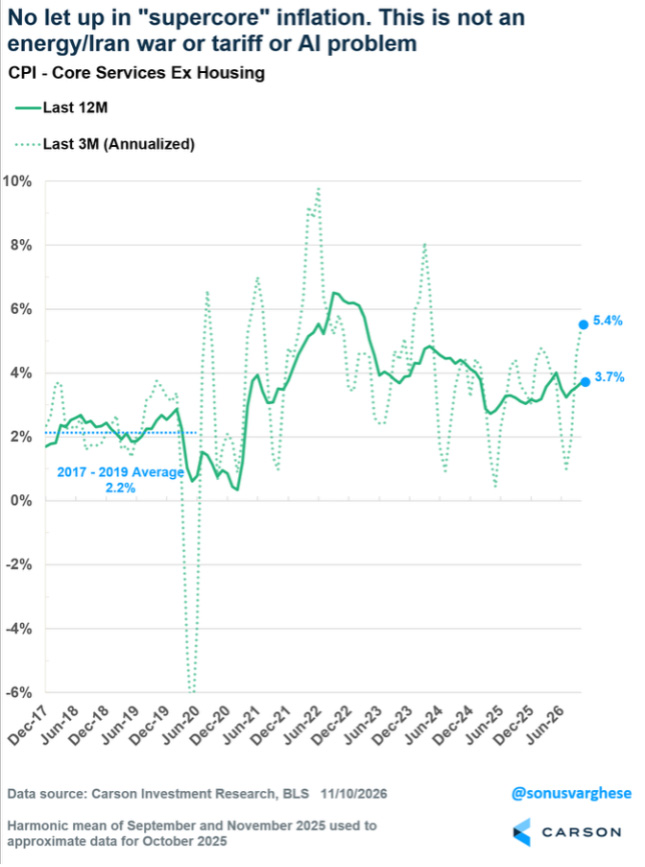
While some of it is obviously tied to energy prices (like airfares), this category is mostly tied to the labor market and wage growth. And the labor market is looking pretty good.
Even sticky prices are elevated
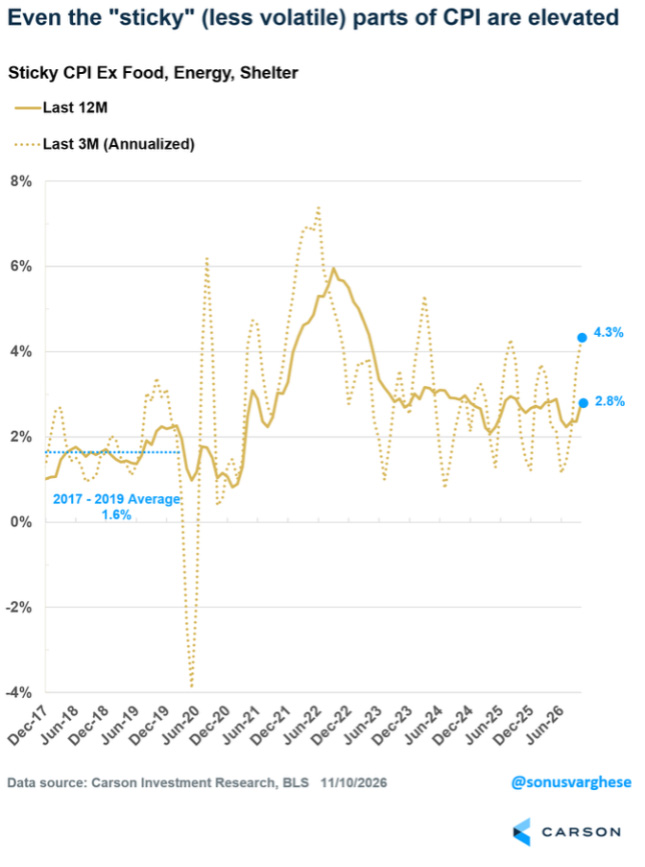
A final cut of the inflation data really underlines the problem. The Atlanta Federal Reserve calculates something called Sticky Price CPI, excluding food, energy, and shelter. It measures inflation for items whose prices typically don’t change frequently. This index rose at an annualized pace of 5.8% in October, taking the three-month run-rate to 4.3% and the 12-month pace to 2.8%. These readings are well above the 2017–2019 pace of 1.6%.
The risk of fiddling while the economy runs hot
The big picture is that we’re nowhere close to normal inflation levels. What’s striking is that the Fed seems relatively calm about the inflation picture even though it’s nowhere close to target and doesn’t look like it’s heading there anytime soon, even while the unemployment rate runs historically low. After holding off on raising rates at its October meeting, the Fed seems strangely comfortable allowing inflation (and the economy) to run hot. But that adds to the increasing risk that the Fed falls further behind.
Based on guidance from Fed officials, markets are pricing in three more rate hikes over the next seven months, including one in December. Yet that would take the policy rate to just 4.6%, despite continued strength in the economy. In mid-2023, nominal GDP growth was also near 6% and unemployment was similar at 4.1%, but inflation was lower (with an arguably better outlook) and the policy rate was 5.4%. So the Fed (and markets) may have to adjust rate expectations higher heading into 2027. The longer the Fed waits, the greater the chance it ultimately inflicts more economic (and market) pain to bring inflation down. What looks supportive for markets today can therefore create the conditions for a much tougher policy response later. That’s the risk of fiddling while the economy runs hot.
S&P 500 — A capitalization-weighted index of 500 stocks designed to measure performance of the broad domestic economy through changes in the aggregate market value of 500 stocks representing all major industries.
The NASDAQ 100 Index is a stock index of the 100 largest companies by market capitalization traded on NASDAQ Stock Market. The NASDAQ 100 Index includes publicly traded companies from most sectors in the global economy, the major exception being financial services.
The views stated in this letter are not necessarily the opinion of Cetera Wealth Services LLC and should not be construed directly or indirectly as an offer to buy or sell any securities mentioned herein. Investors cannot invest directly in indexes. The performance of any index is not indicative of the performance of any investment and does not take into account the effects of inflation and the fees and expenses associated with investing.
A diversified portfolio does not assure a profit or protect against loss in a declining market.
All investing involves risk, including the possible loss of principal. There is no assurance that any investment strategy will be successful. This information is from sources believed to be reliable, but Cetera Wealth Services, LLC cannot guarantee or represent that it is accurate or complete.
9238949.1 -1126-C
